What should one look for when reading projection numbers for COVID-19? An insight into the broad framework for modelling infectious diseases, and what makes a good model.
Over the past few months, you have probably come across projection models being cited in official press briefings, online dashboards, and the news, and wondered why these models show starkly varying magnitudes of cases and deaths.
Navigating through this information can be challenging, but with a broad understanding of the infectious diseases’ framework and its key metrics in your arsenal, you will be able to discern any numbers that come your way.
The role of projection models in disease outbreaks
The spurt of COVID-19 projections on social media, blog posts, and data science competitions might provide the illusion that projection models are a recent phenomenon; perhaps, a product of the data science revolution attuned to produce sensational headlines.
That is not the case.
Epidemiological modelling has been intrinsic to the crisis response and management strategies of governments and international organizations, and the science of epidemiological modelling has standardized frameworks for developing mathematical and statistical models that are used to determine if an outbreak will advance into an epidemic, and to predict the trajectory of disease spread in a region.
The criticism levied on some of the COVID-19 models is more targeted to the application of general statistical techniques unfounded in epidemiological theory, lax assumptions, and overt under and overestimation of model parameters, rather than questioning the relevance of projections.
Projection models have, and will remain critical in curbing a disease outbreak.
The epidemiological framework for infectious diseases
The most frequently used mathematical framework for infectious diseases are compartmental models, where the population is “compartmentalized” into various groups, and deterministic mathematical methods are used to estimate the composition of each of these groups as the disease spreads over time.
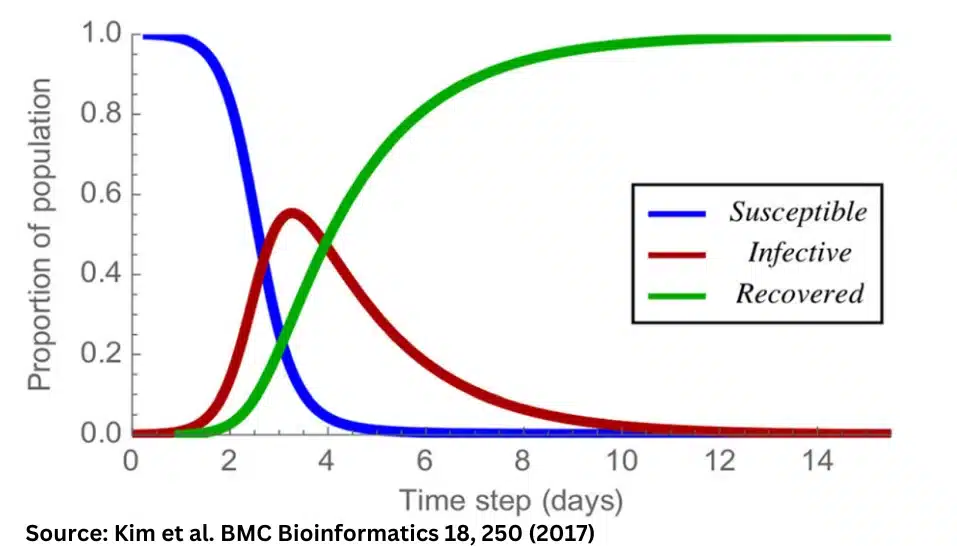
A basic Susceptible-Infectious-Removed (SIR) model can be used to demonstrate the compartmental framework for modelling infectious diseases.
The SIR model first compartmentalizes the total population into three groups:
a. The Susceptible group consists of people who are susceptible to contracting COVID-19. This includes people who have never been infected with COVID-19 but are susceptible to contracting the disease. As COVID-19 is a novel disease, it is typically assumed that every individual in the population is susceptible if they have not already been infected with the disease.
b. The Infectious group consists of people infected with COVID-19, and are therefore infectious, possessing the ability to spread the infection to susceptible people.
c. The Removed group consists of people who have either recovered from COVID-19, or died from the disease. From an epidemiological perspective, there is no difference between recoveries and deaths as they both result in infectious group contracting. However, from an ethical and humanitarian perspective, countries strive to have more recoveries than deaths.
The model assumes that the aforementioned groups are mutually exclusive – that is, a person cannot belong to two groups at the same time, and have a linear flow – that is, a person moves from “Susceptible” to “Infectious” to “Removed” in this linear order. It is assumed therefore, that those who have recovered do not go back to being susceptible.
Transitional stages of disease spread
During an infectious disease outbreak, the population moves from being susceptible to getting infected, and then being removed through recovery or death. At every stage of the infectious disease spreading through a population, the composition of each of these groups changes depending on the Infection Rate (called, beta β) and the Removal Rate (called, gamma γ).
The Infection Rate is the number of susceptible people infected per day, which takes into account the probability of infection upon contact with an infected person, the number of infectious people, and the susceptible people in a population.
The Removal Rate is the number of days it takes to recover from the disease.
At the initial point of a novel infectious disease outbreak, the entire population is in the Susceptible group. As the disease progresses, the size of the Susceptible group decreases as people move to the Infectious group, and the size of the Removed group increases as people recover or die from the disease. The Infectious group changes in size at different points of time, depending on the measures taken by individuals and governments to curb the spread.

The rate of change in each of these groups, when modeled in relation to time provides insights on the progression of the disease at a given point of time.

The primary metric of the SIR model is called the Reproduction Rate (called, R0 or Infection Rate (β)/Recovery Rate(γ)), which estimates the number of susceptibles infected by an infectious person after taking into account recoveries of infectious people. If this rate is greater than 0, the infectious disease is considered an epidemic, as it shows the potential for rapid spread among the susceptibles. The objective of policy interventions is to bring the Reproduction Rate closer to 0.
Bringing the Reproduction rate (R0) to zero
The Reproduction rate can be brought to 0 by reducing spread from infectious to susceptible people, and by reducing the time period for recovery, which further reduces the chances of spread.
In the context of COVID-19, the prevalence of asymptomatic patients necessitates the inclusion of testing as an additional variable in the model. Higher testing rates allow for the prompt identification of infectious persons. This, combined with social distancing reduces potential contact between the two groups.
The use of masks and hygiene practices such as hand-washing, on the other hand, reduces the probability of a susceptible person contracting the disease even if they come in contact with an infectious person.
Gauging the projections made by a model
Given all this information, what should one look for when reading projection numbers?
As a reader, you can take a few easy steps to gauge a model’s projections:
1. A good model takes into account as many “real-world” factors as possible, and its estimates for the Infection Rate and Recovery Rate are based on localized empirical data to the best extent possible. For example, a COVID-19 model that projects the trajectory for India based on the infection rate in China will be less accurate than a model that uses estimates from local data.
The SIR model outlined above is the most basic rendition of an infectious disease model. Most COVID-19 models developed by certified government bodies and academic institutions account for births and deaths, migration, and even individual social distancing metrics.
2. Most models used by governments and international organizations document their estimates and sources. A good model ascribes to transparency in data sources and methodology. You may also lookup the developers to see if the team constituted of epidemiologists or experts in infectious diseases.
3. All models make assumptions to condense real-world factors into quantifiable mathematical models. However, some assumptions are more likely to be met than others. In most cases, every model will present multiple case scenarios – for example, variations of the infection rate, where some scenarios present more conservative rates than others.
4. It is important to acknowledge that ongoing research and advancements will drastically change outcomes. SARS-CoV2 is a novel coronavirus whose mechanics are still not fully known. As you’ve seen with the SIR model, advancements can drastically alter the outcomes of a model. For example, if there is a vaccine that is developed, countries might not progress to stage 2, where there are more infectious people than susceptibles. Similarly, any advancements in treatment can reduce the recovery period and bring down the Reproduction rate. Existing models might not have anticipated advancements in vaccine development, so they may present more grave projections than what a country will see with vaccine development.
5. Acknowledge the function of mathematical models. The purpose of mathematical models is to chart out numerical trajectories using data. In the real world, however, governments need to make decisions based on other information that a mathematical model will supplement. A good example of this is the adoption of a herd immunity strategy by some governments. Theoretically, the SIR model shows that the fastest way to transition through an infectious disease is to move rapidly from susceptible to infected to removed. However, in practice, having the majority of a country’s population in the infectious group is going to mean a shortage of beds, ventilators, doctors, cemeteries, and workforce.
Mathematical models are efficient at what they are meant to do – compute projections based on a set of estimates, functions, and assumptions made by their creators. They are, therefore, only as good as the information they have been provided.


Add Comment