Over 22 million people have been infected by SARS-CoV-2 so far, and 780,000 have lost their lives. Two different takes present two numerically divergent perceptions on the same tragedy of death.
A dark divine trick by the gods above, COVID-19 has brought us to terms with the importance of data and numbers. In the plethora of metrics, parameters, and rates surrounding this pandemic, the most important number of all has to be the number of deaths. For all its epidemiological significance, it is the loss of a human life that quantifies the true severity of any disease.
Over 22 million people have been infected by SARS-CoV-2 so far, and 780,000 have lost their lives. That is the equivalent of a mid-sized Indian town wiped out completely. And yet, it is a meagre 3.5 percent of the total confirmed infections. Two different takes present two numerically divergent perceptions on the same tragedy of death.
Fatality calculations help identify sub-populations most at-risk and evaluate the quality of healthcare infrastructure in a community. But this pandemic has seen death presented via a variety of metrics. World Health Organization (WHO) cites the varying approaches adopted by countries to COVID-19 as a cause for this.
Two measures
There are two measures to determine the proportion of infected individuals with fatal outcomes.
- Case Fatality Ratio (CFR) estimates the proportion of deaths among identified confirmed cases.
- Infection Fatality Ratio (IFR) estimates the proportion of deaths among all infected individuals.


While IFR seems statistically more informative, the more common of the two seems to be the CFR. And there is a good reason for this.
To measure IFR accurately, the number of infections and deaths caused by the disease must be known in all entirety. For COVID-19, a proportion of infected people have gone, and will go undetected – either because they are asymptomatic or have only mild symptoms, failing to present at healthcare facilities. Protocols in a number of countries restrict testing for such cases. A true number of infections will, thus, never come to light.
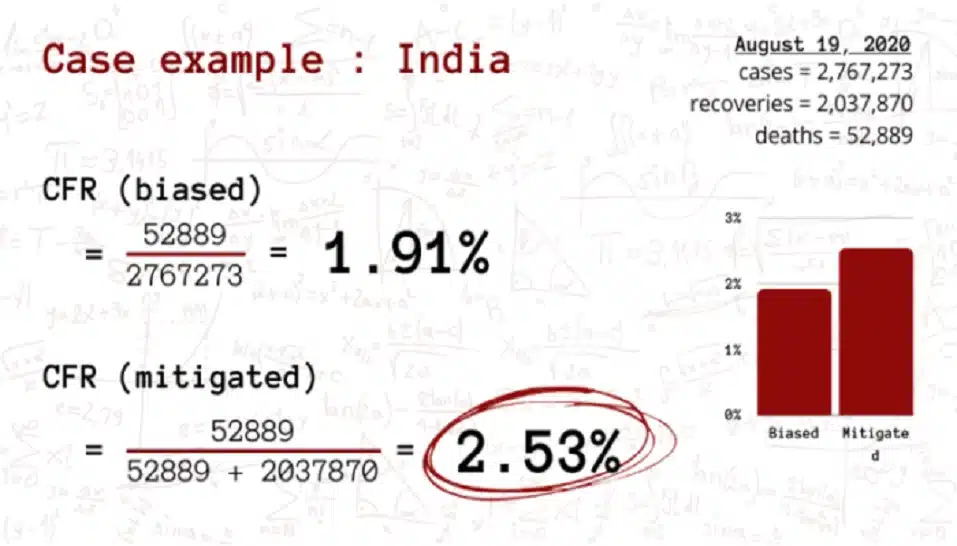
CFR, on the other hand, measures the proportion of people confirmed to have been infected, who meet a fatal end. Reliable CFR can only be obtained after the end of the outbreak. This is because the calculation of CFR makes two assumptions:
- The likelihood of detecting cases remains consistent throughout the outbreak.
- All cases are resolved – either recovered or died – and there are no remaining active cases.
For COVID-19, both these assumptions are wrong – as evolving testing protocols lead to greater detection of cases, and a big share of confirmed infections remain active.
‘Biased’ approach

CFR calculation – the way we mostly see done – stands biased for an ongoing pandemic. WHO has repeated this assertion in its scientific brief of August 8. To mitigate this, CFR for the ongoing pandemic should be restricted to resolved cases.

This mitigation may swell up the CFR value, but it presents a clearer picture of how the infection is behaving. However, this does not take care of all bias. Lags in data reporting as well as the difference in speeds to recovery and death will either overestimate or underestimate CFR. Statistical techniques have a way of working around this, predicting a future CFR value based on probabilities and past outcomes.
One other number that surfaces occasionally is the mortality rate, expressed as deaths per 100,000 population. Calculating COVID-induced mortality would help identify the pandemic’s burden on the overall mortality rate of a country.
For the statisticians and epidemiologists among us, all math makes sense, and all of it is significant. The question is, which number presents the most accurate picture at that moment. After all, no amount of math belittles lives lost unexpectedly.


